Trimaran: Load-aware scheduling plugins #
Trimaran is a collection of load-aware scheduler plugins described in Trimaran: Real Load Aware Scheduling .
Currently, the collection consists of the following plugins.
- TargetLoadPacking : Implements a packing policy up to a configured CPU utilization, then switches to a spreading policy among the hot nodes. (Supports CPU resource.)
- LoadVariationRiskBalancing : Equalizes the risk, defined as a combined measure of average utilization and variation in utilization, among nodes. (Supports CPU and memory resources.)
- LowRiskOverCommitment : Evaluates the performance risk of overcommitment and selects the node with lowest risk by taking into consideration (1) the resource limit values of pods (limit-aware) and (2) the actual load (utilization) on the nodes (load-aware). Thus, it provides a low risk environment for pods and alleviate issues with overcommitment, while allowing pods to use their limits.
The Trimaran plugins utilize a load-watcher to access resource utilization data via metrics providers. Currently, the load-watcher supports three metrics providers: Kubernetes Metrics Server , Prometheus Server , and SignalFx .
There are two modes for a Trimaran plugin to use the load-watcher : as a service or as a library.

load-watcher as a service #
In this mode, the Trimaran plugin uses a deployed load-watcher service in the cluster as depicted in the figure below. A watcherAddress configuration parameter is required to define the load-watcher service endpoint. For example,
Instructions on how to build and deploy the load-watcher can be found here . The load-watcher service may also be deployed in the same scheduler pod, following the tutorial here .
load-watcher as a library #
In this mode, the Trimaran plugin embeds the load-watcher as a library, which in turn accesses the configured metrics provider. In this case, we have three configuration parameters: metricProvider.type , metricProvider.address and metricProvider.token .
The configuration parameters should be set as follows.
- KubernetesMetricsServer (default)
- http://prometheus-k8s.monitoring.svc.cluster.local:9090
- metricProvider.token : set only if an authentication token is needed to access the metrics provider.
The selection of the load-watcher mode is based on the existence of a watcherAddress parameter. If it is set, then the load-watcher is in the ‘as a service’ mode, otherwise it is in the ‘as a library’ mode.
In addition to the above configuration parameters, the Trimaran plugin may have its own specific parameters.
Following is an example scheduler configuration.
Configure Prometheus Metric Provider under different environments #
Invalid self-signed SSL connection error for the Prometheus metric queries The Prometheus metric queries may have invalid self-signed SSL connection error when the cluster environment disables the skipInsecureVerify option for HTTPs. In this case, you can configure insecureSkipVerify: true for metricProvider to skip the SSL verification.
OpenShift Prometheus authentication without tokens. The OpenShift clusters disallow non-verified clients to access its Prometheus metrics. To run the Trimaran plugin on OpenShift, you need to set an environment variable ENABLE_OPENSHIFT_AUTH=true for your trimaran scheduler deployment when run load-watcher as a library.
A note on multiple plugins #
The Trimaran plugins have different, potentially conflicting, objectives. Thus, it is recommended not to enable them concurrently. As such, they are designed to each have its own load-watcher.
Trimaran: Real Load Aware Scheduling in Kubernetes
Conference: kubecon + cloudnativecon north america 2021, authors: chen wang , abdul qadeer.
- Trimaran is a set of plugins for Kubernetes clusters that optimize resource allocation and load balancing
- The Target Load Packing plugin aims to achieve high utilization across all nodes while maintaining a safe margin for CPU usage spikes
- The Load Variation Risk Balancing plugin computes a risk score based on CPU and memory utilization and chooses the bottleneck resource score
- Trimaran uses multiple metric sources and caches data to avoid overwhelming metric providers
- Future work includes integrating Trimaran with other schedulers and incorporating additional resources like IO and network latency
Post a comment
Related work, ⚡ lightning talk: power-aware scheduling in kubernetes, capacity scheduling for elastic resource sharing in kubernetes, clusterless - utilizing a cluster of clusters seamlessly, node resource management: the big picture, efficient scheduling of high performance batch computing for analytics workloads with volcano.
- Sign up with Facebook or Sign up with email →
KubeCon + CloudNativeCon Europe 2024
Sign up or log in to save this to your schedule, view media, leave feedback and see who's attending.
Asser Tantawi
- Content Experience Level Advanced
Platform products
- Red Hat Enterprise Linux A flexible, stable operating system to support hybrid cloud innovation.
- Red Hat OpenShift A container platform to build, modernize, and deploy applications at scale.
- Red Hat Ansible Automation Platform A foundation for implementing enterprise-wide automation.
- Start a trial Assess a product with a no-cost trial.
- Buy online Buy select products and services in the Red Hat Store.

Featured cloud services
- Red Hat OpenShift Service on AWS
- Red Hat OpenShift AI
- Microsoft Azure Red Hat OpenShift
By category
- Application platform
- Artificial intelligence
- Edge computing
- IT automation
- Linux standardization
By organization type
- Financial services
- Industrial sector
- Media and entertainment
- Public sector
- Telecommunications
By customer
- British Army
- HCA Healthcare
- Macquarie Bank
- Tata Consultancy Services
- Search all success stories
- Open Innovation Labs
- Technical Account Management
Training & certification
- All courses and exams
- All certifications
- Verify a certification
- Skills assessment
- Learning subscription
- Learning community
- Red Hat Academy
- Connect with learning experts
- Red Hat System Administration I (RH124)
- Red Hat OpenShift Administration I (DO280)
- Red Hat Certified Engineer (RHCE)
- Application modernization
- Cloud computing
- Cloud-native applications
- Virtualization
- See all topics
- What are cloud services?
- What is edge computing?
- What is hybrid cloud?
- Why build a Red Hat cloud?
- Cloud vs. edge
- Red Hat OpenShift vs. Kubernetes
- Learning Ansible basics
- What is Linux?
More to explore
- Customer success stories
- Events and webinars
- Podcasts and video series
- Resource library
- Training and certification
For customers
- Our partners
- Red Hat Ecosystem Catalog
- Find a partner
For partners
- Partner Connect
- Become a partner
- Access the partner portal
- Our company
- How we work
- Our social impact
- Development model
- Subscription model
- Product support
Open source
- Open source commitments
- How we contribute
- Red Hat on GitHub
Company details
- Analyst relations
Communities
- For system administrators
- For architects
- Customer advocacy
Recommendations
As you browse redhat.com, we'll recommend resources you may like. For now, try these.
- All Red Hat products
- Tech topics
- Red Hat resources
Select a language
- Training & services
Red Hat blog
How to Bring your own Scheduler into OpenShift with the Secondary Scheduler Operator
- Back to all posts
Tags: Topics
To understand the Secondary Scheduler Operator, we need to understand the Kubernetes scheduler. The Kubernetes scheduler is an enterprise grade stable component in Kubernetes that decides where to place the incoming pods by a two step operation of filtering and scoring. The Kubernetes scheduler works well for applications that need to schedule pods in a sequence, for example a web application. Now the customer sees the benefits of Kubernetes, like DevOps and portability. They want to transform their specialized workload like HPC, Telco into containers and run it in Kubernetes. The default scheduler that works well for web servers does not work well for these specialized applications because these applications have special needs from the scheduler. For example:
- Coscheduling : Start, execute and finish all pods at same time.
- Topology Aware Scheduler : Schedule pods based on node topology.
- Load Aware Scheduler : Schedule pods based on load of the nodes.
So there is a need for new schedulers to run specialized workloads.
OpenShift is Red Hat’s enterprise Kubernetes distribution. This means OpenShift has the same scheduler as upstream Kubernetes, which is stable and enterprise grade but best suited for applications that need to schedule pods in a sequence. We in Red hat always listen to our customers and partners that there is a need to bring in their own scheduler, which can best run their application.
The Secondary Scheduler Operator allows customers or partners to bring in their own scheduler in OpenShift and run their application with that customized scheduler.OpenShift 4.x has been re-architected to be a self hosted platform which uses the same OpenShift constructs that any workload running on OpenShift uses. In order to safeguard the control components from the custom scheduler that the end user (customer) can bring in, we decided to have a secondary scheduler which does not have any impact on the control plane components.
Architecturally the default scheduler is responsible for schedu ling all the workloads including control plane components; however if the customer chooses to bring their own scheduler, they can leverage secondary scheduler operator to manage the workloads of their choice but the control plane components would still use the default scheduler shipped with OpenShift.
The following diagram explains the overall flow of how to add your scheduler as payload via the Secondary Scheduler Operator provided by Red Hat.
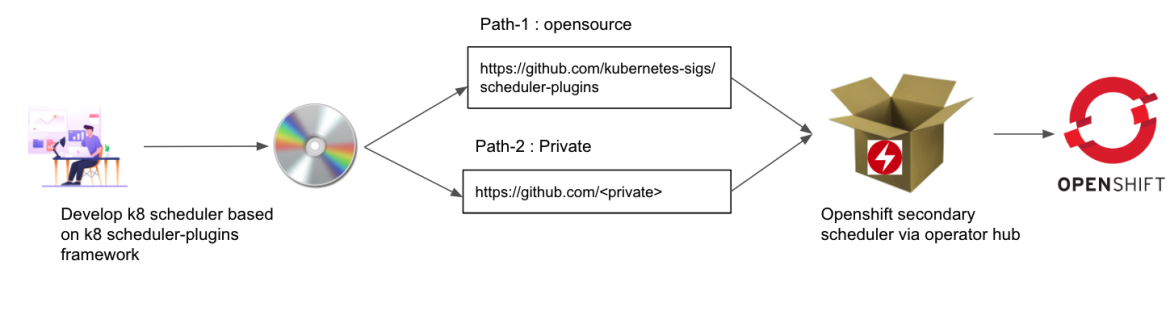
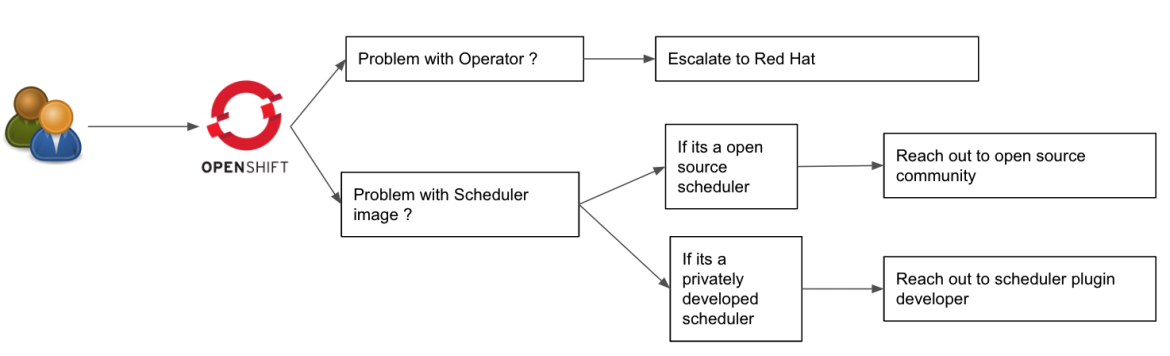
There is a separation of responsibility when a customer installs their own scheduler via this operator. Customers are responsible for maintaining their custom scheduler and Red Hat is responsible for the operator.
In this example we will walk you through how easy it is to install the Load aware scheduling plugin via the Secondary Scheduler Operator.
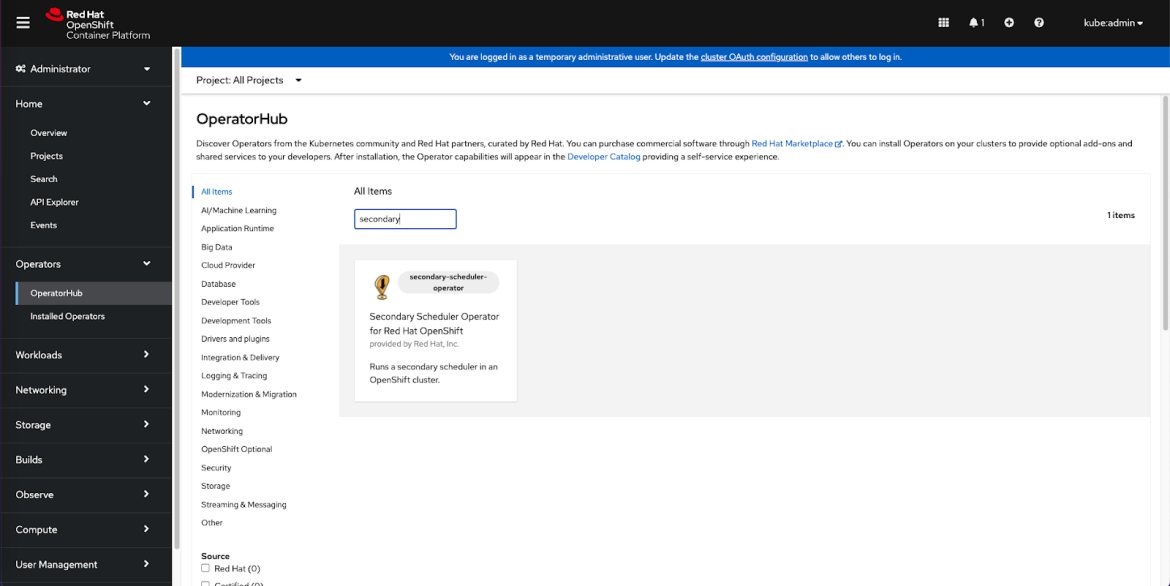
Step 1: Install the Secondary Scheduler Operator
- Create a namespace openshift-secondary-scheduler-operator to install the Secondary Scheduler Operator first.
- Open the OperatorHub console to search for the Secondary Scheduler Operator.
- Click on Install to install the Secondary Scheduler Operator.
- Choose the project namespace as openshift-secondary-scheduler-operator .
- Now the operator is ready to use.
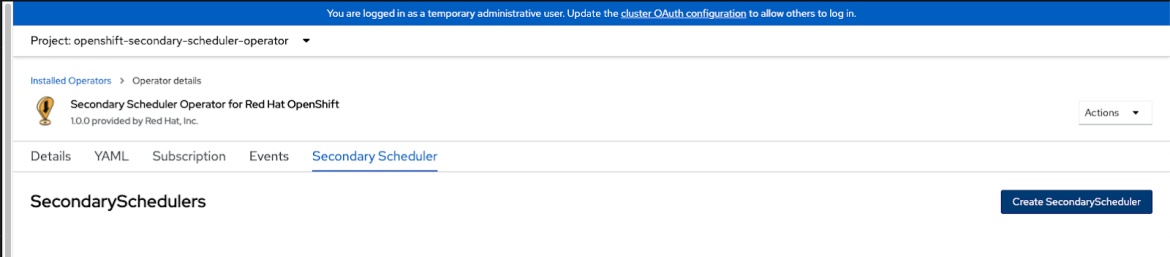
Step 2: Configure the Secondary Scheduler Operator to install Trimaran scheduler as a secondary scheduler
- Create a config.yaml to define KubeSchedulerConfiguration for the Trimaran scheduler that runs TargetLoadPacking plugin. The schedulerName should be set as secondary-scheduler .
- Run the following commands to obtain the ${PROM_URL} and ${PROM_TOKEN} , and replace these with the real Prometheus endpoint and token in config.yaml .
- Create a ConfigMap secondary-scheduler-config for the Trimaran KubeSchedulerConfiguration under the openshift-secondary-scheduler-operator namespace .
- Click on Create SecondaryScheduler to create an instance of SecondaryScheduler and configure the SecondaryScheduler YAML accordingly.
- Configure the schedulerConfig to point to the secondary-scheduler-config ConfigMap.
- Configure the schedulerImage to the default scheduler-plugin image that includes Trimaran plugins.
- Then click Create to install a secondary scheduler instance that runs the Trimaran scheduler.
- Finally, the operator will install a secondary-scheduler deployment running under openshift-secondary-scheduler-operator namespace. Check the logs to verify if the Trimaran scheduler is successfully running.
- GitHub link
- Documentation
- Red hat Support
- Red Hat Sales
About the authors
Gaurav singh, jan chaloupka.
- Red Hat Enterprise Linux
- Red Hat OpenShift
- Red Hat Ansible Automation Platform
- Cloud services
- See all products
- Developer resources
- Customer support
- Red Hat value calculator
Try, buy, & sell
- Product trial center
- Red Hat Marketplace
- Red Hat Store
- Buy online (Japan)
Communicate
- Contact sales
- Contact customer service
- Contact training
- About Red Hat
We’re the world’s leading provider of enterprise open source solutions—including Linux, cloud, container, and Kubernetes. We deliver hardened solutions that make it easier for enterprises to work across platforms and environments, from the core datacenter to the network edge.
Red Hat legal and privacy links
- Contact Red Hat
- Red Hat Blog
- Diversity, equity, and inclusion
- Cool Stuff Store
- Red Hat Summit
- Privacy statement
- Terms of use
- All policies and guidelines
- Digital accessibility
This package is not in the latest version of its module.
Trimaran: Load-aware scheduling plugins
Trimaran is a collection of load-aware scheduler plugins described in Trimaran: Real Load Aware Scheduling .
Currently, the collection consists of the following plugins.
- TargetLoadPacking : Implements a packing policy up to a configured CPU utilization, then switches to a spreading policy among the hot nodes. (Supports CPU resource.)
- LoadVariationRiskBalancing : Equalizes the risk, defined as a combined measure of average utilization and variation in utilization, among nodes. (Supports CPU and memory resources.)
- LowRiskOverCommitment : Evaluates the performance risk of overcommitment and selects the node with lowest risk by taking into consideration (1) the resource limit values of pods (limit-aware) and (2) the actual load (utilization) on the nodes (load-aware). Thus, it provides a low risk environment for pods and alleviate issues with overcommitment, while allowing pods to use their limits.
The Trimaran plugins utilize a load-watcher to access resource utilization data via metrics providers. Currently, the load-watcher supports three metrics providers: Kubernetes Metrics Server , Prometheus Server , and SignalFx .
There are two modes for a Trimaran plugin to use the load-watcher : as a service or as a library.
load-watcher as a service
In this mode, the Trimaran plugin uses a deployed load-watcher service in the cluster as depicted in the figure below. A watcherAddress configuration parameter is required to define the load-watcher service endpoint. For example,
Instructions on how to build and deploy the load-watcher can be found here . The load-watcher service may also be deployed in the same scheduler pod, following the tutorial here .

load-watcher as a library
In this mode, the Trimaran plugin embeds the load-watcher as a library, which in turn accesses the configured metrics provider. In this case, we have three configuration parameters: metricProvider.type , metricProvider.address and metricProvider.token .

The configuration parameters should be set as follows.
- KubernetesMetricsServer (default)
- http://prometheus-k8s.monitoring.svc.cluster.local:9090
- metricProvider.token : set only if an authentication token is needed to access the metrics provider.
The selection of the load-watcher mode is based on the existence of a watcherAddress parameter. If it is set, then the load-watcher is in the 'as a service' mode, otherwise it is in the 'as a library' mode.
In addition to the above configuration parameters, the Trimaran plugin may have its own specific parameters.
Following is an example scheduler configuration.
Configure Prometheus Metric Provider under different environments
Invalid self-signed SSL connection error for the Prometheus metric queries The Prometheus metric queries may have invalid self-signed SSL connection error when the cluster environment disables the skipInsecureVerify option for HTTPs. In this case, you can configure insecureSkipVerify: true for metricProvider to skip the SSL verification.
OpenShift Prometheus authentication without tokens. The OpenShift clusters disallow non-verified clients to access its Prometheus metrics. To run the Trimaran plugin on OpenShift, you need to set an environment variable ENABLE_OPENSHIFT_AUTH=true for your trimaran scheduler deployment when run load-watcher as a library.
A note on multiple plugins
The Trimaran plugins have different, potentially conflicting, objectives. Thus, it is recommended not to enable them concurrently. As such, they are designed to each have its own load-watcher.
Documentation 
- func GetEffectiveResource(pod *v1.Pod, fn func(container *v1.Container) v1.ResourceList) *framework.Resource
- func GetMuSigma(rs *ResourceStats) (float64, float64)
- func GetResourceData(metrics []watcher.Metric, resourceType string) (avg float64, stDev float64, isValid bool)
- func GetResourceLimits(pod *v1.Pod) *framework.Resource
- func GetResourceRequested(pod *v1.Pod) *framework.Resource
- func SetMaxLimits(requests *framework.Resource, limits *framework.Resource)
- type Collector
- func NewCollector(trimaranSpec *pluginConfig.TrimaranSpec) (*Collector, error)
- func (collector *Collector) GetNodeMetrics(nodeName string) ([]watcher.Metric, *watcher.WatcherMetrics)
- type NodeRequestsAndLimits
- func GetNodeRequestsAndLimits(podInfosOnNode []*framework.PodInfo, node *v1.Node, pod *v1.Pod, ...) *NodeRequestsAndLimits
- type PodAssignEventHandler
- func New() *PodAssignEventHandler
- func (p *PodAssignEventHandler) AddToHandle(handle framework.Handle)
- func (p *PodAssignEventHandler) OnAdd(obj interface{}, _ bool)
- func (p *PodAssignEventHandler) OnDelete(obj interface{})
- func (p *PodAssignEventHandler) OnUpdate(oldObj, newObj interface{})
- type ResourceStats
- func CreateResourceStats(metrics []watcher.Metric, node *v1.Node, podRequest *framework.Resource, ...) (rs *ResourceStats, isValid bool)
Constants 
Variables ¶.
This section is empty.
Functions 
Func geteffectiveresource ¶ added in v0.26.7.
GetEffectiveResource: calculate effective resources of a pod (CPU and Memory)
func GetMuSigma ¶ added in v0.24.9
GetMuSigma : get average and standard deviation from statistics
func GetResourceData ¶ added in v0.24.9
GetResourceData : get data from measurements for a given resource type
func GetResourceLimits ¶ added in v0.26.7
GetResourceLimits : calculate the resource limits of a pod (CPU and Memory)
func GetResourceRequested ¶ added in v0.24.9
GetResourceRequested : calculate the resource requests of a pod (CPU and Memory)
func SetMaxLimits ¶ added in v0.26.7
SetMaxLimits : set limits to max(limits, requests) (Note: we could have used '(r *Resource) SetMaxResource(rl v1.ResourceList)', but takes map as arg )
type Collector ¶ added in v0.24.9
Collector : get data from load watcher, encapsulating the load watcher and its operations
Trimaran plugins have different, potentially conflicting, objectives. Thus, it is recommended not to enable them concurrently. As such, they are currently designed to each have its own Collector. If a need arises in the future to enable multiple Trimaran plugins, a restructuring to have a single Collector, serving the multiple plugins, may be beneficial for performance reasons.
func NewCollector ¶ added in v0.24.9
NewCollector : create an instance of a data collector
func (*Collector) GetNodeMetrics ¶ added in v0.24.9
GetNodeMetrics : get metrics for a node from watcher
type NodeRequestsAndLimits ¶ added in v0.26.7
NodeRequestsAndLimits : data ralated to requests and limits of resources on a node
func GetNodeRequestsAndLimits ¶ added in v0.26.7
GetNodeRequestsAndLimits : total requested and limits of resources on a given node plus a pod
type PodAssignEventHandler 
This event handler watches assigned Pod and caches them locally
Returns a new instance of PodAssignEventHandler, after starting a background go routine for cache cleanup
func (*PodAssignEventHandler) AddToHandle ¶ added in v0.24.9
AddToHandle : add event handler to framework handle
func (*PodAssignEventHandler) OnAdd 
Func (*podassigneventhandler) ondelete ¶, func (*podassigneventhandler) onupdate ¶, type resourcestats ¶ added in v0.24.9.
ResourceStats : statistics data for a resource
func CreateResourceStats ¶ added in v0.24.9
CreateResourceStats : get resource statistics data from measurements for a node
Source Files 
- collector.go
- resourcestats.go
Directories 
Keyboard shortcuts.
Trimaran: 基于实际负载的K8s调度插件

在 K8s 集群治理过程中,常常会因 CPU 、内存等高使用率状况而形成热点,既影响了当前节点上 Pod 的稳定运行,也会导致节点发生故障的几率的激增。
为了应对集群节点高负载、负载不均衡等问题,需要动态平衡各个节点之间的资源使用率,因此需要基于节点的相关监控指标,构建集群资源视图,从而为下述两种治理方向奠定实现基础:
- 在 Pod 调度阶段,加入优先将 Pod 调度到资源实际使用率低的节点的节点Score插件
- 在集群治理阶段,通过实时监控,在观测到节点资源率较高、节点故障、Pod 数量较多等情况时,可以自动干预,迁移节点上的一些 Pod 到利用率低的节点上
针对方向一,可以通过赋予Kubernetes调度器感知集群实际负载的能力,计算资源分配和实际资源利用之间的差距,优化调度策略。
针对方向二,社区给出了Descheduler方案,Descheduler 可以根据一些规则和策略配置来帮助再平衡集群状态,当前项目实现了十余种策略。
注意:Descheduler等方案存在一些与主调度策略不一致的可能性
本文将针对方向一的实现进行详细说明,方向二中Descheduler将在后续文中进行相关介绍。

Kubernetes提供了声明式的资源模型,核心组件(调度器、kubelet和控制器)的实现能够满足QoS需求。然而,由于下述一些原因,该模型会导致集群的低利用率:
- 用户很难准确评估应用程序的资源使用情况,因而对于Pod的资源配置,无从谈起
- 用户可能不理解资源模型,从而直接使用Kubernetes默认调度插件(Score)(默认插件不考虑实际节点利用率值)。
依托实时资源使用情况,构建调度插件以调度pod,最终的目标是在不破坏Kubernetes资源模型的前提下,降低集群管理的成本,提高集群的利用率,为了实现上述需要,因此提出以下预期条件:
- 提供可配置的调度插件以提高集群利用率。
- 每个节点的预期CPU利用率不应超过设定百分比(约束条件)。
- 尽量避免影响默认score插件逻辑。
- 该功能以score插件方式实现
作为一家使用公有云的公司,希望通过提升节点实际利用率的方式来降低机器成本。
作为一家拥有的数据中心的公司,希望通过提升节点实际利用率的方式,来减少集群相关的硬件开支和维护。
尽可能地提高资源利用率的方式可能无法解决所有问题,通过扩大集群的规模以处理突如其来的业务高峰总是需要一些时间的,因此集群管理员希望为突发的高峰留下足够的扩展空间,此时可能就需要有足够的时间向集群添加更多的节点,当然该问题可以通过空闲集群节点、forzen资源方式来缓解,类似函数计算中的热启动等。

设计方案由以下组件组成,监控指标整合器(Metrics Provider)、负载监测器(Load Watcher)、数据库及调度插件组成,如下图所示,重点为两个插件算法,即 TargetLoadPacking和 LoadVariationRiskBalancing。这两个插件算法都使用来自负载监控器的指标,用不同的算法对节点进行评分。

监控指标整合器支持时间序列数据库,如Prometheus、InfluxDB、Kubernetes Metrics Server等。
负载监测和分析器整合在同一进程中,其中监测模块负责通过监控指标整合器(Metrics Provider)获取集群内的资源使用指标,如CPU、内存、网络和IO统计数据等。它将这些数据进行本地缓存,为了实现容错,其在主机数据库中持久化一些聚合数据。分析器负责检测不良监控指标,并实施一些补救措施。坏指标可能是由于监控缺失或可能发生的错误而产生的,在未来方案的扩展中,可以使用ML模型来分析度量。
负载监测器将缓存过去15分钟、10分钟和5分钟窗口的指标,并通过REST API提供查询服务。
这是以文件形式存储的本地数据库,目的是在负载监测器的缓存因崩溃而丢失时,能够快速恢复,并在不影响延迟的情况下执行调度策略。对于HA设置,每个负载监测器进程将在本地维护其相应的文件。
这里使用了K8s的调度器框架,注册定制的基于实际负载感知的调度器插件。该插件主要包括以下两个算法:
- TargetLoadPacking:它是bin pack算法的best fit变体(刷过算法应该知道,背包算法),它通过节点的实际资源利用率给节点打分,使所有被利用的节点都有大约x%的利用率。一旦所有节点达到x%的利用率,它就会转到least fit。
- LoadVariationRiskBalancing:这是一个节点排序插件,根据节点资源利用率的平均值和标准差对节点进行排序。它不仅是为了平衡负载,也是为了避免负载变化引起的风险。
a. TargetLoadPacking插件
插件将扩展Score的扩展点。K8s调度器框架在调度一个pod时,调用Score方法为每个节点打分。
- 获取当前节点的利用率,以进行评分,假定该节点为A。
- 计算当前pod的CPU总的request和overhead,假定该结果为B。
- 计算如果pod被调度到该节点下预期的利用率,通过添加即U=A+B。
- 如果U <= X%,返回(100 - X)U/X + X作为分数
- 如果X% < U <= 100%,返回50(100 - U)/(100 - X)
- 如果U>100%,返回0
举例说明,假设有三个节点X、Y和Z,每个节点有四个cpu,分别使用了1、2和3个cpu。简单起见,假设要调度的pod有0个CPU request和overhead,设定X=50%。
根据上述算法,50%是所有节点预设的目标利用率,当然可以把它降低到40%,这样在高峰期或意外负载期间,它超过50%的机会就会少得多。因此,一般来说,为了达到X%的利用率(在实践中建议使用X-10值)。
在算法的第二步,一个变体的算法是使用当前pod的总CPU limit而不是request,以期获取一个更宽松的利用率的上限预期。
其中节点利用率的X%阈值通过插件的参数进行配置。

上图表述了算法概述中函数表现,通过上图可以发现算法表征的多样性。
- 当利用率从0到50%时,优先选择调度pod至这些节点。
- 当利用率超过50%时,在这些 "热"节点之间调度pod时,针对这些节点线性降权。
- 正的斜率从50开始,而不是从0开始,因为分数的范围是0-100,分数越低的节点得分越高,这样分数就越可观,其他插件对调度结果的影响也不会太大。
- 图中有一个断点,由于我们的降权,产生了一个下降坡度。
b. LoadVariationRiskBalancing插件
因为没有考虑到突发性的变化,基于实际平均负载的策略有时是有风险的。LoadVariationRiskBalancing插件不仅可以平衡实际平均负载,还可以降低负载突发性变化引发的风险。假设把所有节点利用率的平均值(M)和标准差(V)绘制成下面的mu-sigma图。在这种情况下,LoadVariationRiskBalancing插件将进行处理,使所有节点的利用率在对角线上对齐,即V + M = c。这里,c是一个常数,表示整个集群的利用率平均值加上标准偏差。总之,考虑到所有节点上的负载随时间动态变化,LoadVariationRiskBalancing插件倾向于选择低风险节点,即负载超出节点可分配总量的节点。

- 获取待调度的Pod 的request的资源,设为r 。
- 获取当前节点所有类型的资源(CPU、Memory、GPU等)的利用率的百分比(0到1),并根据计算的滑动窗口的平均数(V)和标准差(M),进行打分。
- 计算当前节点的每一类资源的得分: 。
- 为每种类型的资源获取一个分数,并将其映射到[0,1]区间: 。
- 计算每个资源的节点优先级分数为:。
- 得到最终的节点分数为:。
举例说明,假设有三个节点N1、N2和N3,要安排的pod的CPU和内存请求为500 milicores和1 GB。所有节点都有4个cpu和8GB的内存。
Pod的资源请求比例可以计算为

然后根据步骤2~4,可以计算出CPU和内存部分利用率的平均值和标准偏差,如下所示。

根据步骤5~6,每类资源和每个节点的得分如下。

根据我计算的分数,节点N3将被选中,分数如下。

如果把这些分数画在mu-sigma图中,经过线性拟合可以把节点的利用率推到对角线sigma = 1 - mu。这里的1表示100%的利用率。这里可以配置的是系数ita,表示mu + ita x sigma <= 100 %,这里选择ita = 1。ita在这里模拟使用率不超过节点容量,假设实际使用率遵循高斯分布,并遵循68-96-99.5规则。
因此,当ita设定为不同的值时,可以得到不同的但不超过容量的线性图。
- ita=1,有16%的风险几率,使用量超过节点容量。
- ita = 2,有2.5%的风险几率,实际使用量超过节点容量。
- ita = 3,有0.15%的风险几率,实际使用量超过节点容量。默认情况下,选择ita=1,因为希望提高整体利用率。ita参数可以通过插件的SafeVarianceMargin配置。

a. REST API
GET /watcher说明:返回集群中所有节点的指标
GET /watcher/{hostname}说明:返回给定主机名的指标
注意:如果没有指标,则返回404
控制器以goroutine方式监听.spec.nodeName事件,其保持一个节点→pod映射的时间顺序状态,用于存储过去5分钟内成功调度的pod。在不同的调度周期中维护该状态,并供TargetLoadPacking/LoadVariationRiskBalancing Score插件使用。它将有助于在指标异常的时候根据前期实际分配情况来预测利用率。

启用上述插件将会与调度器中的2个默认评分插件的产生冲突:"NodeResourcesLeastAllocated "和 "NodeResourcesBalancedAllocation "插件。因此,建议在启用上述插件时禁用默认两个插件。
如果利用率的指标在很长一段时间内不可用,将退回到基于分配的best fit的bin pack算法,而无需用户干预。为了达到X%的利用率,建议在实践中将该值设置为X - 10,以下为其他注意项与缺陷:
- 将上述约束条件2作为Filter插件。
- 在最初的设计中没有解决不服预期的调度结果(热节点,碎片等)被取消的问题。
- 在最初的设计中没有考虑内存、网络和磁盘等利用率。
由于笔者时间、视野、认知有限,本文难免出现错误、疏漏等问题,期待各位读者朋友、业界专家指正交流。
1.https://github.com/kubernetes-sigs/scheduler-plugins/tree/master/kep/61-Trimaran-real-load-aware-scheduling
本文分享自 DCOS 微信公众号, 前往查看
如有侵权,请联系 [email protected] 删除。
本文参与 腾讯云自媒体分享计划 ,欢迎热爱写作的你一起参与!
Copyright © 2013 - 2024 Tencent Cloud. All Rights Reserved. 腾讯云 版权所有
深圳市腾讯计算机系统有限公司 ICP备案/许可证号: 粤B2-20090059 深公网安备号 44030502008569
腾讯云计算(北京)有限责任公司 京ICP证150476号 | 京ICP备11018762号 | 京公网安备号11010802020287
Copyright © 2013 - 2024 Tencent Cloud.
All Rights Reserved. 腾讯云 版权所有
Better together: IBM Research and Red Hat make OpenShift enterprise-ready
Red Hat and IBM Research have worked together on projects for years, including grass-roots collaborations, often in relevant open-source communities. But when IBM Research connected with Red Hat’s Products and Technologies leadership to find synergies, we used our joint expertise to make an even greater impact on our clients, particularly for the hybrid cloud platform.
Through this collaboration, Red Hat and IBM have been able to use our joint expertise to make an even greater impact on our clients.
Red Hat now has some 15 engineering scrum teams that include IBM Research partner engineers. Some of these projects are closer to the product phase, while others are longer-term research efforts. For example, in July of 2020 our teams started collaborating on the core container platform to further-boost resource management in OpenShift, the application development platform on OpenShift serverless and observability, and application services on cloud-native Java (a project called Read more about the cloud native journey to Red Hat OpenShift using Quarkus . Quarkus ), as well as cloud security.
It all started with open source
In July 2020, we launched a formal collaboration effort — matching up the expertise we needed between our teams to work as partner engineers. It’s been just over a couple of years, but we’ve already achieved a lot together.
We’ve worked on eventing capabilities in OpenShift serverless to enable event-driven, serverless applications on OpenShift. We’ve jointly launched Konveyor , an open-source project aimed at modernizing and moving enterprise applications to the open hybrid cloud.
Our extension to the Linux Foundation’s open source sigstore project, which Red Hat considers strategic, allows developers to sign, verify, and enforce cloud infrastructure configuration. And then there is Iter8 , a Kiali extension that automates the progressive rollout of new microservice versions of applications and analyzes the performance of competing versions.
Collaboration goes both ways
Take Red Hat OpenShift . Based on Kubernetes , it provides a consistent foundation for developing, deploying and managing cloud-native applications and services across the hybrid cloud.
Kubernetes has a generic, open-source resource manager that’s a great default scheduler for general application workloads. It struggles, though, with specialized workloads when it comes to AI, machine learning and analytics. And this is where IBM Research and Red Hat come in.
For years, IBM had been developing more advanced workload schedulers for use in hybrid cloud environments. When the two companies came together, Research presented the work it had already been doing on more sophisticated scheduling with Kubernetes. Red Hat showed IBM how to apply some of that work to drive client use cases on OpenShift.
Working as one team, Red Hat and IBM Research turned their combined efforts into two components:
- One is Trimaran, a set of load-aware scheduler plugins that rely on the actual use on the worker nodes — something Kubernetes doesn’t take into account.
- And then there is the Vertical Pod Autoscaler (VPA), a controller that lets developers automatically resize containers in real time during runtime.
PayPal, the global payments giants, is one of the joint customers putting this new load-aware scheduling capacity into production .
IBM and Red Hat both continue to contribute to open source projects. For example, some clients needed OpenShift to manage virtual machine workloads, as well as containers. For that, IBM Research made key contributions to OpenShift Virtualization , based on the open-source project KubeVirt .
IBM and Red Hat are now collaborating to build compatibility between IBM Digital AI Cores and Red Hat OpenShift. Digital AI Cores serve as accelerators — using custom architecture, software and algorithms — to transform existing semiconductor technologies to speed computation and decrease power consumption while maintaining model accuracy. We also plan to enable AI hardware accelerator deployment across hybrid cloud infrastructure: multi-cloud, private cloud, on-premise and edge.
It’s now been three years, and there is still so much to do together. As IBM’s hybrid cloud and AI strategies evolve, this partnership will continue to contribute to the open source community, while providing better tools for our enterprise customers.
- Priya Nagpurkar
- Hybrid Cloud Platform
- Note 1 : Read more about the cloud native journey to Red Hat OpenShift using Quarkus . ↩︎
Kubernetes Scheduler
In Kubernetes, scheduling refers to making sure that Pods are matched to Nodes so that Kubelet can run them.
Scheduling overview
A scheduler watches for newly created Pods that have no Node assigned. For every Pod that the scheduler discovers, the scheduler becomes responsible for finding the best Node for that Pod to run on. The scheduler reaches this placement decision taking into account the scheduling principles described below.
If you want to understand why Pods are placed onto a particular Node, or if you're planning to implement a custom scheduler yourself, this page will help you learn about scheduling.
kube-scheduler
kube-scheduler is the default scheduler for Kubernetes and runs as part of the control plane . kube-scheduler is designed so that, if you want and need to, you can write your own scheduling component and use that instead.
Kube-scheduler selects an optimal node to run newly created or not yet scheduled (unscheduled) pods. Since containers in pods - and pods themselves - can have different requirements, the scheduler filters out any nodes that don't meet a Pod's specific scheduling needs. Alternatively, the API lets you specify a node for a Pod when you create it, but this is unusual and is only done in special cases.
In a cluster, Nodes that meet the scheduling requirements for a Pod are called feasible nodes. If none of the nodes are suitable, the pod remains unscheduled until the scheduler is able to place it.
The scheduler finds feasible Nodes for a Pod and then runs a set of functions to score the feasible Nodes and picks a Node with the highest score among the feasible ones to run the Pod. The scheduler then notifies the API server about this decision in a process called binding .
Factors that need to be taken into account for scheduling decisions include individual and collective resource requirements, hardware / software / policy constraints, affinity and anti-affinity specifications, data locality, inter-workload interference, and so on.
Node selection in kube-scheduler
kube-scheduler selects a node for the pod in a 2-step operation:
The filtering step finds the set of Nodes where it's feasible to schedule the Pod. For example, the PodFitsResources filter checks whether a candidate Node has enough available resources to meet a Pod's specific resource requests. After this step, the node list contains any suitable Nodes; often, there will be more than one. If the list is empty, that Pod isn't (yet) schedulable.
In the scoring step, the scheduler ranks the remaining nodes to choose the most suitable Pod placement. The scheduler assigns a score to each Node that survived filtering, basing this score on the active scoring rules.
Finally, kube-scheduler assigns the Pod to the Node with the highest ranking. If there is more than one node with equal scores, kube-scheduler selects one of these at random.
There are two supported ways to configure the filtering and scoring behavior of the scheduler:
- Scheduling Policies allow you to configure Predicates for filtering and Priorities for scoring.
- Scheduling Profiles allow you to configure Plugins that implement different scheduling stages, including: QueueSort , Filter , Score , Bind , Reserve , Permit , and others. You can also configure the kube-scheduler to run different profiles.
What's next
- Read about scheduler performance tuning
- Read about Pod topology spread constraints
- Read the reference documentation for kube-scheduler
- Read the kube-scheduler config (v1) reference
- Learn about configuring multiple schedulers
- Learn about topology management policies
- Learn about Pod Overhead
- Volume Topology Support
- Storage Capacity Tracking
- Node-specific Volume Limits
Was this page helpful?
Thanks for the feedback. If you have a specific, answerable question about how to use Kubernetes, ask it on Stack Overflow . Open an issue in the GitHub Repository if you want to report a problem or suggest an improvement .

- 2020年openGauss
- 2022年PolarDB
- 2023年OceanBase
- 课程中心 推荐优质内容、热门课程
- 学习路径 预设学习计划、达成学习目标
- 知识图谱 综合了解技术体系知识点
- 课程库 快速筛选、搜索相关课程
- 视频学习 专业视频分享技术知识
- 电子文档 快速搜索阅览技术文档
- SQLRUN 在线数据库即时SQL运行平台
- 数据库在线实训平台 实操环境、开箱即用、一键连接
- AWR分析 上传AWR报告,查看分析结果
- SQL格式化 快速格式化绝大多数SQL语句
- SQL审核 审核编写规范,提升执行效率
- PLSQL解密 解密超4000字符的PL/SQL语句
- OraC函数 查询Oracle C 函数的详细描述
- 智能助手小墨 关于数据库相关的问题,您都可以问我

使用Trimaran在Kubernetes中进行实时负载感知调度

点击上方 云原生CTO ,选择 设为星标
优质文章,每日送达

----------------------------------------------
🌛 "错的人会走散,对的人迟早会遇见"

「【只做懂你de云原生干货知识共享】」
为什么在Kubernetes中进行调度效率低下?
Kubernetes中的本机调度由kube-scheduler服务处理。通过声明性资源模型定义Pod的资源利用,并且kube-scheduler与kubelet服务一起使用以提供pod QoS保证。该模型可能导致群集资源的利用率低下和浪费,因为在调度决策中不考虑活动节点的资源利用率。此外,用户在定义pod系列规格时很难预测其pod系列的正确使用值。
Trimaran Scheduler
从Kubernetes 1.15开始,调度程序已变得灵活多变,可以使用Scheduling Framework进行自定义。(PayPal)的团队利用这一优势开发了Trimaran调度程序,该调度程序可处理活动节点利用率值,以有效利用集群资源并节省成本。并且还开发了TargetLoadPacking插件和Load Watcher并将其贡献给了开源社区。
TargetLoadPacking插件
在调度框架中有多个扩展点,我们可以将其挂钩起来进行定制。TargetLoadPacking插件扩展了分数扩展点,该点负责对节点进行评分,以便在每个调度周期中调度pod。我们的算法是标准bin pack算法的混合变体,该算法通过从最适合到最不适合的方式,支持在目标利用率周围的节点上打包pod。换句话说,给定x%的目标利用率,插件更喜欢接近x%的节点。目前支持CPU利用率,并且还可以扩展到多个资源。

本教程将指导您在任何K8s设置(包括Minikube,Kind等)中部署Trimaran调度程序。Trimaran取决于要运行的负载监视程序服务,而后者又取决于要从中加载度量标准的度量标准提供程序。当前,受支持的提供程序是Kubernetes Metrics Server(默认)和SignalFx,目前正在进行工作以增加对Prometheus的支持。在部署负载监视程序之前,请确保在K8s群集中部署要使用的指标提供程序。
请注意,在撰写本文时,您的Kubernetes版本至少应为v1.19.0。
作为Trimaran调度程序部署的一部分,我们将为两个服务(配置了TargetLoadPacking插件的kube-scheduler(trimaran镜像)和Load Watcher服务(load-watcher镜像))创建Docker镜像,并将它们作为单个pod进行部署。
load-watcher可以在此处找到构建Docker镜像的说明。
要构建trimaran图像,请首先构建kube-scheduler镜像,如下所示:
将以下Trimaran调度程序配置保存在中scheduler-config.yaml:
强烈建议禁用上述两个本机插件,以防止评分冲突
在上面克隆的存储库的根目录中创建一个包含以下内容的Dockerfile:
如下构建Docker镜像:
以下是Trimaran K8部署的YAML规范:
将以上内容保存在名为“ trimaran-scheduler.yaml”的文件中,并使用以下命令进行部署:
对于要使用Trimaran调度程序进行调度的任何Pod,schedulerName需要trimaran使用相应Pod spec YAML文件中的值进行修改。下面是一个示例pod规范:
验证是否已使用以下命令将Pod进行了调度,并且状态为“正在运行”。
在Trimaran的工作有一些有趣的领域可以扩展。例如,多资源(CPU、内存、网络带宽等),用于利用率预测的ML/AI模型。
https://medium.com/paypal-tech/real-load-aware-scheduling-in-kubernetes-with-trimaran-a8efe14d51e2
最后推荐一本非常有价值的书籍,我自己也在看,讲解的非常清晰透彻
这本书真的是深入挖掘了kubernetes生产化时间过程中所遇到的挑战和方案细节,帮你少走弯路的一本好书,经过这几年云原生技术的沉淀的积累,很多的企业都在使用这门技术,对于很多入门或是进行深入研究其真理的技术人员,帮助很大,如果你认真阅读你会中你可以学到ebay在生产上使用k8s多年总结的经验,增加你对此技术的深入理解,同样也是一本升职加薪的好帮手,对一些生产的疑问,你都可以在书中找到你的答案,现在点击下方即可获取。

Search code, repositories, users, issues, pull requests...
Provide feedback.
We read every piece of feedback, and take your input very seriously.
Saved searches
Use saved searches to filter your results more quickly.
To see all available qualifiers, see our documentation .
- Notifications
Have a question about this project? Sign up for a free GitHub account to open an issue and contact its maintainers and the community.
By clicking “Sign up for GitHub”, you agree to our terms of service and privacy statement . We’ll occasionally send you account related emails.
Already on GitHub? Sign in to your account
Trimaran: Restructure for ease of adding trimaran plugins #402
atantawi commented Jul 15, 2022
Sorry, something went wrong.
Successfully merging a pull request may close this issue.
为 Kubernetes Scheduler 启用 Trimaran 插件

在没有为整个集群的 Pods 良好 设置 Requests/Limits 的情况下,Scheduler 无法针对负载所使用的资源进行 Node 节点分配。此时,我们需要一个额外的打分插件,将资源更为空闲的 Node 节点评分拉高,使 Pod 更积极的调度在这些节点上,从而使整个集群的所有节点负载均衡。
Scheduler Plugins 项目 是对 Kubernetes 调度器组件 kube-scheduler 的替换,它包含了多个插件。这里我们仅介绍其中 「Trimaran」 插件的使用。
Trimaran 支持三种打分插件,我们使用 LoadVariationRiskBalancing 来综合 CPU、内存实际使用情况为 Node 节点打分。
以下我们以 1.26 版本的 Kubernetes 为例,为集群更换 Scheduler Plugins 调度器,并启用调度器的 Trimaran 插件、以及为 Trimaran 配置 LoadVariationRiskBalancing 打分算法。
插件本身有 2 个部分,也是 2 个镜像。其中一个镜像用于替换集群默认的 kube-scheduler ,它包含了原装调度器的所有功能,在没有任何额外配置的情况下,它的行为和原装调度器保持一致。另一个镜像则是 scheduler-plugins-controller ,它是替换调度器的控制器。
这 2 个镜像需要和当前 Kubernetes 版本保持一致。例如,我们的 Kubernetes 版本是 1.26 ,我们需要使用 0.26 的替换调度器、以及它的控制器。
我们先部署它的控制器,它有两个 crd 虽然在本实践中完全没有用到,但是依赖项目,所以我们先导入一下:
然后导入控制器的 deployment、以及它和调度器所需权限的 rbac:
现在可以替换调度器了吧?
别急。还记得我们本次实践的目标么——我们需要根据节点的真实负载情况进行调度——因此,我们需要为替换调度器准备能够感知集群节点真实负载的组件。
Trimaran 使用 load-watcher 对真实负载进行感知。而 load-watcher 支持三种方式测量集群节点的负载: Metrics Server 、 Prometheus 、 SignalFx 。我们使用最轻便的 Metrics Server :
安装完成后,你可以通过 kubectl top nodes 命令查看 Metrics Server 是否正常工作。
由于 Trimaran 内置的 load-watcher 有毒,我们这里选择独立部署 load-watcher 。 编译:
准备完这些,终于,我们可以替换 kube-scheduler 了。
我们需要替换每一台 Control Plane 节点上的 kube-scheduler ,因此,请妥善备份你的 /etc/kubernetes/manifests/kube-scheduler.yaml 。
首先我们准诶替换调度器的额外配置文件:
我们把它保存为 /etc/kubernetes/sched-cc.yaml 。当然, watcherAddress 地址,请替换为你刚刚部署的 service/load-watcher 的 ClusterIP 地址。
最后我们开始修改 /etc/kubernetes/manifests/kube-scheduler.yaml :
- 删去启动参数 --kubeconfig=/etc/kubernetes/scheduler.conf
- 删去启动参数 --leader-elect=true
- 添加启动参数 --config=/etc/kubernetes/sched-cc.yaml
- 添加 sched-cc.yaml 的 volume 和 volumeMount
现在,你可以观察 kube-scheduler 是否重启正常。如果出现问题,使用备份恢复即可还原。
在所有 Control Plane 节点上替换 kube-scheduler ,即可完成。
Scheduler Plugins 项目以及 Trimaran 插件的文档书写比较混乱, load-watcher 项目文档文档更为缺乏。
实际操作中,请根据你的集群版本,切换到项目对应版本的 release 分支查看文档及说明。
IMAGES
VIDEO
COMMENTS
Trimaran Scheduler. As of Kubernetes 1.15, the scheduler has been made flexible for customizations with the Scheduling Framework. Our team at PayPal leveraged this to develop the Trimaran ...
Kubernetes provides a declarative resource model that core components (scheduler and kubelet) honor to behave consistently and satisfy QoS guarantees.\nHowever, using this model can lead to low-utilization of the cluster for the following reasons: \n \n; It is hard for users to estimate accurate resource usage for applications.
Trimaran is a collection of such custom kube-scheduler plugins that we demonstrate in this blog. Trimaran enables kube-scheduler place pods on nodes being aware of the load on nodes. It uses a ...
The Trimaran plugins utilize a load-watcher to access resource utilization data via metrics providers. Currently, the load-watcher supports three metrics providers: Kubernetes Metrics Server, Prometheus Server, and SignalFx. \n. There are two modes for a Trimaran plugin to use the load-watcher: as a service or as a library. \n
KEP - Trimaran: Real Load Aware ... To achieve this goal, we can make the Kubernetes scheduler aware of the gap between resource allocation and actual resource utilization. Taking advantage of the gap may help pack pods more efficiently, while the default scheduler that only considers pod requests and allocable resources on nodes cannot.
With the Trimaran scheduler plug-ins, users can achieve basic load-aware scheduling that is not implemented in the default Kubernetes scheduler. Trimaran plug-ins can either balance the usage on nodes so that all nodes reach a certain percentage of utilization, or it can prioritize nodes that have lower risk when overcommitting the pods.
Don't miss out! Join us at our next event: KubeCon + CloudNativeCon Europe 2022 in Valencia, Spain from May 17-20. Learn more at https://kubecon.io The confe...
Trimaran; Network-Aware Scheduling; Additionally, the kube-scheduler binary includes the below list of sample plugins. These plugins are not intended for use in production environments. ... Participation in the Kubernetes community is governed by the Kubernetes Code of Conduct. About. Repository for out-of-tree scheduler plugins based on ...
The Trimaran plugins utilize a load-watcher to access resource utilization data via metrics providers. Currently, the load-watcher supports three metrics providers: Kubernetes Metrics Server, Prometheus Server, and SignalFx. There are two modes for a Trimaran plugin to use the load-watcher: as a service or as a library. load-watcher as a service #
Kubernetes is a popular solution for container orchestration and cluster management. Cluster management creates opportunity to improve resource utilization which can provide an organization with cost savings. To achieve this, we can make the native Kubernetes scheduler aware of the gap between its declarative resource allocation model and actual node resource utilization.
Basically, Trimaran plugins are load-aware schedulers which place pods on nodes based on actual measured node resource utilization, while considering requests and limits specifications of resources. Having utilization as an objective helps (1) minimize power consumption by targeting an optimal range of utilization, (2) avoid congestion and ...
The Kubernetes scheduler is an enterprise grade stable component in Kubernetes that decides where to place the incoming pods by a two step operation of filtering and scoring. ... Create a ConfigMap secondary-scheduler-config for the Trimaran KubeSchedulerConfiguration under the openshift-secondary-scheduler-operator namespace. ...
The Trimaran plugins utilize a load-watcher to access resource utilization data via metrics providers. Currently, the load-watcher supports three metrics providers: Kubernetes Metrics Server, Prometheus Server, and SignalFx. There are two modes for a Trimaran plugin to use the load-watcher: as a service or as a library. load-watcher as a service
Kubernetes is a popular solution for container orchestration and cluster management. Cluster management creates opportunity to improve resource utilization which can provide an organization with cost savings. ... TargetLoadPacking and LoadVariationRiskBalancing under the Trimaran framework to address this problem with collaboration between ...
针对方向一,可以通过赋予Kubernetes调度器感知集群实际负载的能力,计算资源分配和实际资源利用之间的差距,优化调度策略。 针对方向二,社区给出了Descheduler方案,Descheduler 可以根据一些规则和策略配置来帮助再平衡集群状态,当前项目实现了十余种策略。
One is Trimaran, a set of load-aware scheduler plugins that rely on the actual use on the worker nodes — something Kubernetes doesn't take into account. And then there is the Vertical Pod Autoscaler (VPA), a controller that lets developers automatically resize containers in real time during runtime.
In Kubernetes, scheduling refers to making sure that Pods are matched to Nodes so that Kubelet can run them. Scheduling overview A scheduler watches for newly created Pods that have no Node assigned. For every Pod that the scheduler discovers, the scheduler becomes responsible for finding the best Node for that Pod to run on. The scheduler reaches this placement decision taking into account ...
Abdul Qadeer. Excited to share my talk in Kubecon NA 2021 with co-presenter Chen Wang from IBM for our work on load-aware scheduling in Kubernetes. One of the largest conferences I have attended ...
Trimaran Scheduler. 从Kubernetes 1.15开始,调度程序已变得灵活多变,可以使用Scheduling Framework进行自定义。(PayPal)的团队利用这一优势开发了Trimaran调度程序,该调度程序可处理活动节点利用率值,以有效利用集群资源并节省成本。
The load watcher is responsible for the cluster-wide aggregation of resource usage metrics like CPU, memory, network, and IO stats over time windows from a metrics provider like SignalFx, Prometheus, Kubernetes Metrics Server etc. developed for Trimaran: Real Load Aware Scheduling in Kubernetes. It stores the metrics in its local cache, which can be queried from scheduler plugins.
Currently, we have two load-aware trimaran plugins: TargetLoadPacking and LoadVariationRiskBalancing. As we plan to add more trimaran plugins, we need to extract common components for efficiency and ease of addition. In particular, the following are common among trimaran plugins: Load watcher arguments
Trimaran 支持三种打分插件,我们使用 LoadVariationRiskBalancing 来综合 CPU、内存实际使用情况为 Node 节点打分。 以下我们以 1.26 版本的 Kubernetes 为例,为集群更换 Scheduler Plugins 调度器,并启用调度器的 Trimaran 插件、以及为 Trimaran 配置 LoadVariationRiskBalancing 打分算法。
Kubernetes enables autoscaling at the cluster/node level as well as at the pod level, two different but fundamentally connected layers of Kubernetes architecture. K8s Autoscaler (Native) Autoscaler is a Kubernetes native tool that increases or decreases the size of a Kubernetes cluster (by adding or removing nodes), based on the presence of ...